
The National Academy of Sciences has posted an Environmental Impacts of Wind-Energy Projects report. The report found that [wind turbines had] "no evidence of significant impacts on bird populations." In particular, the report sets bird kills in context by examining the relative harm to birds by common man made environmental and ecological impacts. That data can be found here.
In a nutshell, wind turbines have led to the untimely deaths of approximately 20,000-38,000 birds, compared to the roughly 100,000,000-900,000,000 birds killed by hitting buildings. (Note the extra zeros). This just shows just how patently nonsensical, irrational, and politicized the notion of windmills killing birds was from the get go. (By the way, for the purposes of the chart in this entry, I had to cheat and change the 28,000 value for turbines to 280,000 just to get that sliver blue line to appear in the chart, relative to the scale of 500,000,000 for building birdkill.)
Tuesday, July 10, 2007
Bird Kill
Tuesday, June 19, 2007
More Maps! Real-time Wind Speeds

Any long time reader of this blog knows that I am an aficionado of maps. A good place to get started with my cartographic pursuits is at my All Power Is Geography Series.
Wind power is only economical in "really" windy locations. If you are building big turbine wind farms, that means that the wind is constantly blowing above 25-30 mph (What the industry calls Class 5 and above wind speeds). That's windy enough to blow your cat end over end, forever. It's that windy only on the coasts, better yet offshore, on the edges of the great lakes, on top of mountain ranges, and in a central sliver of the plains from the Dakotas through Texas. (In fact, it's so NOT windy in the Southeast that Senators from that region are claiming that the present Senate energy bill with renewable portfolio standards is an income depletion tax to wind-endowed regions elsewhere, sorry Southeast.)
For those wondering about wind power for metro wind applications (residential/commercial/municipal use), we don't need the extreme winds above, but we still need a "good" wind resource. What is a good wind resource? It's a place that the wind blows quite often at 20 mph, and sometimes faster to 30-40 mph (What the wind industry calls Wind Classes 2-4). So, where does the wind blow like that?
Fortunately, we can piggyback from the wind sailing/surfing community to get real-time data.
Check out iwindsurf for some very cool, real time and forecast maps of wind speeds for your region. (Shown is California map, where green color would make for effective distributed wind power. )
Friday, June 1, 2007
Small Wind VC Funding
Southwest Windpower is in the news today, with an additional Series B funding round. More details here.
NYTIMES PIECE ON WIND

Busy news day. Big, front of business pages article today in the New York Times on wind power in America. Very sweet.
Thursday, May 31, 2007
Bush, Kyoto, and Global Warming
Today, there is news that Bush calls for global goals for emissions.
Following up from my post below about Energy Demand and Productivity data from the McKinsey report, this news is quite timely. Analyzing the present carbon emission contributions and growth rates across the globe, - and seeing the shared and increasingly distributed extent of global carbon emissions - you get a sense that the U.S. rejection position on Kyoto wasn't as dead wrong as the environmentalists and liberals (myself included) were first thinking.
As I see it, the ability to globally align an effort to curb carbon emissions comes down to two very simple, conflicting notions.
Notion One: Since the developed world did most of the harm in CO2 emissions to date, and continues to pollute the most per capita, the burden to improve and fix the problem lies squarely and firstly there, in countries like the United States, Germany, United Kingdom, Canada, and Japan.
Notion Two: We're all in this together. Regardless of how we got here, we need to look at the straightforward math of who's putting out CO2, how much growth will occur in each polluter country, and a means to reduce those growth rates across all countries. That math says that the biggest gains/improvements can be made only when we are reducing carbon emissions in the biggest emitter countries.
The Kyoto accord was very much in alignment with Notion One - developed countries pay now, and that China and India get a "free pass" until the next round of cuts next time.
But what was the right approach? This is a hard dilimmna, and I've shifted my view CLOSER to the Bush administration. One can say that Notion One has progressive justice and ethics on it's side, but I am seeing a new fairness and efficiency in Notion two. Maybe it's just becoming a parent, and arbitrarily putting all my kids in "timeouts" regardless of how, when, and who started the latest ruckuss. The point being, looking to the past and trying to establish total fairness is secondary to fixing the immediate problem at hand.
In fact, if your trying to fix the problems of emissions with one set of countries obeying one set of rules, and then allowing a different set of countries to have no rules, you end up with those countries actually growing the problem you are trying to regulate and fix. That's broken.
Is it fair to crimp on China's growth when they consume 1/20th the power of Americans?
Perhaps "next time around" the solution lies in both sides coming to a compromise approach. Something that balances the fact that sacrifices have to be shared, reduction progress has to be made across the globe, AND that those sacrifices are somehow fair-weighted to both past pollution and present per capita considerations. Heck, a similar compromise approach solved the constitutional crises in forming America in the 1770s by giving smaller States equal representation in one governing body - the Senate, and giving the bigger, more populous states more representation power int e House of Representatives.
Maybe the way to Kyoto isn't through Montreal, but in a bicameral emissions reduction math - everybody pays, and the biggest polluter hogs pay more?
Great Energy Demand Side Data and Presentation
Every once in a while, there is a piece of energy news/reporting that is so good, so clear and compelling, I feel like emailing it to everyone I know. Nowadays, fortunately for them, I don't have to do that anymore, this is what a blog is for :)
E&ETV has posted their May 17th presentation by McKinsey Global Institute on their recent report, "Curbing Global Energy Demand Growth: The Energy Productivity Opportunity".
This is a MUST watch video, and I recommend that open a second browser window so you can see the slides that are being discussed by separately clicking on the SLIDES here:
The most fascinating aspects of this presentation to me were:
#1. Who Knew? Who knew that in the next 20 years, it’s the “
#2. Bitter irony: Energy prices go up, but demand doesn’t necessarily go down globally? Because those very same middle easterners have so much more money/consumption that they EQUAL the diminished demand from the developed world.
#3.
Friday, May 25, 2007
Our First Press: Business 2.0 Article
Wind-Sail has a short write-up in this month's Business 2.0 magazine. You can see it in print, or click through the Business 2.0 issue here. (we're on page 28)
Or you can read the whole blurb below... All very cool and I'll be curious to see what kind of dustup this generates. Of course, another generous thanks to Janet Rae-Dupree for covering this in December on her blog, and now contributing this piece for Business 2.0
Thursday, May 17, 2007
Moving the Needle in Energy Efficiency

One of the most neglected areas of investment/startups in cleantech, in my view, has been in energy efficiency. That now seems to be changing. The New York Times is reporting on an energy efficiency study by the McKinsey Global Institute that examined projected energy savings Americans could achieve with focused energy efficiency standards.
This graphic shows total power used in typical American households (in Quadrillion BTUs), and shows what kinds of savings are achieveable with present advanced techniques.
Below is some additional analysis that helps clarify where the biggest gains are achieveable. In summary, we can cut out total U.S. household energy bill by 35% by implementing existing technology.
If I were investing in the space, I'd look at the Appliance category, as it gets you the most bang for the buck, and a decent improvement ratio from what's out there today.
Wednesday, May 16, 2007
People Moving and Power
Two interesting web connections on the movement of people on the planet and in the United States.
Thanks to Paul Kedrosky for pointing me to this very cool, flash based global map of where people are moving on the planet. Surprised to see the relatively low movement out of China. I suspect that the data has been normalized to mean percentages of inbound and outbound movement. Must be, as China would presumably have orders of magnitude more activity than Peru without normalization. It's a pity that Asia-to-America and Asia-to-Great Britain traffic goes across the rest of the map, as it's hard to discern which dots are going where between and betwixt these edge cities. Someone needs to redo with a "wrap" function so that we can separate out patterns of East-to-West and West-to-East from any country a little easier.
With richer specific data, jonrayjay has parsed U.S. Census bureau data to come up with a notion of the Great Decline of the Coastal Megalopolises. Putting my All Power Is Geography hat on, this population shift in is mostly a net neutral impact for solar, and in general, quite a bad thing for wind. As you can see from even the cartoon picture here, leaving the coasts means leaving some of the best wind resource in America. On the positive side, it means a lot less consumption of heating fuels in the winter. On the negative side, it also means a lot more stain on already constrained internal water resources, and more power to power hungry AC. (Actually, AC consumption and it's strain on the grid is floating north as well.)
Tuesday, May 15, 2007
All Power Is Geography, Part Three
In previous posts, (Power Geographies Part One here, Power Georgraphies Part Two here) I've written about the comparitive nature of renewable energy sources. That we shouldn't be thinking that solar is "competing" with geothermal, tidal, wind etc. but rather, that geographies will dictate local power pareto optimums.
In my third installment, just one more quick example of the geographical nature of local power paretos. This list of City based case studies speaks perfectly to the point that people will optimize their local clean power best on the best local resources available. Again, where it's windy take wind, sunny go solar, etc. etc.
Nothing For Free

So, after trumpeting the Montreal Protocol as an umitigated success in reducing CFCs in the atmosphere and "saving the Ozone layer", I should have known that nothing comes for free. Turns out, according to USA Today article that the replacement coolants — hydrochloroflourocarbons— are potent greenhouse gases that harm the climate, up to 10,000 times worse than carbon dioxide emissions.
O well, maybe we can't get to Kyoto from Montreal after all.
Monday, May 7, 2007
Kyoto by way of Montreal
 Last night, I was talking with a friend about market forces and market failures of carbon emissions. Specifically, we agreed that there is no way that you can price the cost of carbon emissions sufficiently enough to curb the problem on a global scale. Beyond this market failure, we'll most certainly need an enlightened set of government leaders across the globe to initiate hard decisions to change our trajectory. No easy task.
This morning it got me thinking... what does government do well? When does government dictate a policy based on what is right, and then solve the market/economics/pricing of that decision later, especially on an international scale. Well, warfare seems to be one. But what about the environment? And then I found my first answer. CFC emissions. Remember those nasty, ozone-depleting freons that lofted up into the air, turined into chlorine gas, and then wreaked havoc on O3, especially over the polar caps?
The leaders of the world did manage to agree, and drive through policy, substantial change and mitigate the CFC problem. Twenty years after the signing of the Montreal Protocol, CFC emissions are below 20% what they were in 1980, and though it's a slow path, scientists are optimistic that the hole will be completely gone in 50 years.
What was magic in Montreal and how can it help get us to "Kyoto" (a successful, international government campaign to reduce carbon). One quick search on Google and I found this writeup from MIT on Lessons Learned From the Montreal Protocol for Global Warming.
It's a decent read, though personally, I would like to have seen a little more concrete details on how the Protocol was able to push through policy in light of contested scientific data, as well as, which came first, the threat of CFC bans from government, or Dupont's market englightenment that a chemical replacement strategy could be profitable.
In fact, it doesn't matter which came first, because you get a sense that Dupont had sufficient market share and technical know how to make a profit ON the banning of CFCs. I'd say the opposites are true on global warming. No one entity has any controlling share of carbon emissions, and worse, the biggest polluters on the planet (the citzenry of the planet using billions of individual cars, stoves, tree-cutters, etc. ) have zero ways to make profitable moves someplace else, and real, direct costs to doing anything but burning easy and cheap fossil fuels.
The article closes with it's most relevant point, and yet, did little to draw out how the Montreal Protocol tied the science to the policy as quickly and effectively as they did.
- The effectiveness of any strategy on global warming will depend on how well it creates new markets. That much was learned from the Montreal Protocol. But perhaps the greatest lesson is also one of the simplest: when science shows us a looming environmental disaster, we need to act quickly and decisively, regardless of the economic or technical uncertainties.
What we need is an "ozone hole" picture for global warming, a one image graphic that can speak to the impending danger, as well as the comprehensive impact of global warming. Most of us have seen that Al Gore image of rising temperatures and peak years of hot weather. But as a chart, it's not as emotional as a picture, and there are "outlying" years that also create doubt and angles for obstructionists. (such as "why didn't it get warm in the 1950s when carbon emissions took off, etc. etc.). I'm on the hunt, stay tuned...
Determining Your Own Carbon Footprint and Future Carbon Tax Bill

I was doing some back of the envelope math on carbon credits and carbon pricing. I was curious as to how much carbon I produce in my automobile and house, and what the "market price" is for offsetting personal carbon emissions by purchasing carbon "credits."
Starting on the pricing side, the average price for carbon emissions offset seems to be around $15 per metric ton. (See http://www.carboncounter.org/ to get started).
On the carbon generation side, you can calculate your personal "carbon impact" at http://www.becomeafriend.org/carbon/.
In general, my house hold is emitting approximately 18 metric tons of CO2. Unfortuantely, that's quite "above" the 12 metric tons average for a family in America, and we got dinged hard on all the business travelling I do by plane (40% of our footprint and more than both cars combined) Assuming a $15 carbon tax, my household would see a substantial $270 in carbon charges.
Much has been written about the benefits in making this market predictable and deterministic. And even my quick exercise shows that the wild range of $4 to $40 for offset purchase credits could significantly change my potential future carbon tax scenario ($75 to $750 per year). Speaking from a purely market-centric, rational consumer standpoint, I'm not inclined to do a lick of change in my behavior to avoid $75 in taxes, but I could start to consider changes at $750 or higher.
Bringing this back to Wind-Sail and cleantech for a moment. I do think market forces can impact, but not wholly correct, the problems we're creating with carbon emissions and global warming. Unfortunately, as an "externality" to pricing energy, carbon emissions quite literally "break" the market. And any significant trajectory changing behavior is going to have to come from market + government forces. In my next post, I'll look back to the Montreal Protocol, which was a primarily non-market, governmental and policy force that drove the dramatic reduction of ozone-depleating CFCs ("freon") from our lives.
Thursday, May 3, 2007
Is Global Warming At "Phase Two"
My wife had an interesting observation this morning... Her basic sentiment was that the big surge in cleantech and going green is directly driven by the generally warmer temperatures we're experiencing in our daily lives. "It's just warmer all the time, and this has people thinking about carbon in a much more visceral way."
All obvious, yes, but the point here I think is an interesting one. Is it just me, or is the speed of warming stunning. I think we're past the "first warning signs" of an unusually warm winter here or there, or a spot "hot day" in December, or a run of European heat wave weather. Phase one could also be marked by "macro" markers, like melting polar ice caps (too far away to viscerally "feel", and shifting butterflies north in the U.K. (only visceral to butterfly catchers.)
I think we're entering phase two. Phase two has more local, visceral ways to see global warming. Like tropical Palm Trees growing in Tenessee.
What this means for the adoption of cleantech is positive. How quickly this drives real market forces and pricing is less clear.
Here'a a good piece in the New Yorks Times on a "phase two" impact of global warming to gardening in the United States.
The End of Nameplates?
Last month, I wrote about cleantech's erroneous use of 'nameplates' as a key metric for evaluating the power production of renewable energy power systems. (see Nameplate series here, Part Two, and Part Three.)
Since then, I've had the pleasant surprise of two separate VC meetings in which the investors had gotten to the same place I had... that nameplates were not wholly useful and that yearly power produced was the high order bit. Again, in typical VC tap-dancing fashion, I had to reformat on the fly my cost and ROI modelling to fit their newfound attraction to ypp (yearly power produced).
Interestingly, here is a very good write-up on 
France's nuclear power industry,
and what percentage of France's power comes from nuclear power. What's clear to me is that this overly complicated mess could be drastically improved by disregarding installed capacity as a power market statistic. I made similar comments at the end of that post here.
Sunday, April 29, 2007
The Playing Field Was Never Level
Many folks are aware of U.S. and state government efforts to increase subsidies for clean power. These can come in the form of production tax credits for clean power producers, as well as tax rebate and incentives for consumers purchasing solar, wind power systems.
To me, when I hear the word _subsidy_, I think "crutch," and crutch in the worst sense of the word. Something that is deployed in an artificial, unnatural, non-market, and essentially inefficient way to give assistance. I think this is the reaction of most of my friends and family as well. Not sure when the souring of the word "subsidy" occurred, or if there was ever a glory time for it's positive reaction in political discourse. I have my suspects, like the much maligned farm subsidies, or the attack on subsidies that underlied our march to an era of global free trade promotion.
But I think that the general lay person, outside power industries, is probably extremely unaware of the ongoing subsidies that occur across all power and fossil fuel industries. Here is a chart and good writeup from AWEA on the broad based degree of subsidization in American energy policy. Given the source, there may be some degree of bias here. Nonetheless, one gets a sense that a truly level, market based playing field is impossible, and that cleantech subsidies have a long long game of catchup to make up for an estimated $700 billion in dirty tech energy subsidies from 1950-1980 alone.
Tuesday, April 24, 2007
America's Power Footprint

I finally had a Eureka moment today in understanding the 'power footprint' data in the United States. The pie chart above shows which constituents are burning the most coal/oil/gas power in the United States for 2000. What I long struggled with was the appearent "double counting" between the "Electric Power" category, and the household, commercial and industrial categories. Weren't these users also the same end users of "electric power" ???
My Eureka moment came from the footnote on this chart. Yes, these users ALSO use electric power. In other words, natural gas electric plants + coal burning electric plants make up the Electric Power category, and your John Deere, and backup diesel generator, and propane forklift whizzing around Costco make up your residential / commercial / industrial consumers of fossil fuel power.
In some ways, there is a notion of double-counting still going on, because that "electric power" category ends up being consumed in houses, builidings and factories. But in terms of managing future carbon emissions, and pricing systems for carbon, the pie is useful as a starting point in who's going to pay, and what impacts a tax / pricing scheme will have across the economy.
Fortunately, others have appearently had similar thinking, from the National Commission on Energy Policy's Carbon Pricing Report, here's the "no double counting version" of that same pie chart that accurately breaks down the end uses from the Electric Power category. People should be required to show this version of the energy footprint chart to save others from needless confusion.
Monday, April 23, 2007
On Aesthetics, Part Two
In the past, I've written about factors outside the control of Wind-Sail, such as Wind Permits, that may directly impact our success. Another one of those factors, that clearly plays a role in future trajectories for distributed wind is Aesthetics. Specifically, much of today's buying public in America would be concerned about the visual impact of turbines, and perhaps more importantly, whether 'others' such as neighbors and future buyers would be put off be those visual aesthetics of a turbine on their property.
To me, aesthetics are more about past precedence and timing than about intrinsic beauty or not.
Past Precedence
Would anyone tolerate the aesthetics of transmission lines if they were new?![]()
And yet, there are literally millions of these populating our landscapes because we had to have them for our power delivery. Of course, there continues to be concerns today about the safety of these transmission systems, but you don't see a lot of people making the case on the aesthetics of these. They've gotten used to them. or more specifically, there is no alternative to having them.
That's what I mean by power crunch mode, or carbon crunch mode. Someday, we could very well see the power utility mandate the local use of turbines, panels, geothermal, etc. because they'll have no traditional alternatives.
Timing
To me, nothing better exemplifies the role of timing in aesthetics than the Eiffel Tower. Today, the tower is the very epitome of European elegance and design. in fact, the tower is the single most recognized landmark in Europe. Property prices in the 7th arrondissement are some of the highest in Paris, no doubt aided by the appeal of the Champs de Mars and La Tour Eiffel. Yet, it wasn't always this way... Here's an excellent history of the early struggles Monseir Eiffel faced in trying to put up the tower.
From: (Mary Louis King, "A History of Western Architecture" pp.175-195)
The Eiffel Tower was designed by the French engineer and bridge builder Alexandre Gustave Eiffel (1832-1923) for the Paris Exposition of 1889. The tower is 300 m (984 ft) high and consists of an open iron framework making it the highest manmade structure in the world at the time. It was the largest attraction at the Exposition and today it remains the most recognized structure in all of Europe.
It was nearly never built.
After being awarded the contract to build the tower, Eiffel discovered that the Exposition Committee would only grant about a fourth of the monies needed to construct it. Eiffel himself would have to finance the balance. He struck a deal that would make him a very rich man. He agreed to independently find the funders for his tower but he wanted sole control of the tower and its profits for twenty years. They agreed. In a surprise to everyone, including Eiffel, the tower was paid off in the first year.
The deal that Eiffle hammered out is probably what saved the tower from destruction. Many in the arts and civic leaders felt the tower was an abomination. "They have only erected the framework of this monument, It has no skin"
The whole idea that iron -- just iron -- could be beautiful, flew in the face of architectural history. Everyone knew that the great cathedrals and palaces had all been built of stone with the careful craft of ornamentation which adorned them. Sure, iron can play a part in an unseen, underlying structure such had been done with the Statue of Liberty, but to leave it exposed was just poor taste. It was like showing your dirty laundry.
A Committee of Three Hundred was formed and they petitioned for its demise:
Honored compatriot, we come, writers, painters, sculptors, architects, passionate lovers of the beauty of Paris -- a beauty until now unspoiled -- to protest with all our might, with all our outrage, in the name of slighted French taste, in the name of threatened French art and history, against the erection, in the heart of our capital, of the useless and monstrous Eiffel Tower.It may have taken every bit of those twenty years to change some people's minds. All of the other iron buildings built for the Exposition were torn down shortly after (a shame). Today we look upon Eiffel's tower as anything but hideous. Mary Louis King calls it "a monument to nineteenth century architectural engineering and a frank display of structure and material."Are we going to allow all this beauty and tradition to be profaned? Is Paris now to be associated with the grotesque and mercantile imagination of a machine builder, to be defaced and disgraced? Even the commercial Americans would not want this Eiffel Tower which is, without any doubt, a dishonor to Paris. We all know this, everyone says it, everyone is deeply troubled by it. We, the Committee, are but a faint echo of universal sentiment, which is so legitimately outraged. When foreign visitors come to our universal exposition, they will cry out in astonishment," What!? Is this the atrocity that the French present to us as the representative of their vaunted national taste?" And they will be right to laugh at us, because the Paris of the sublime Gothic, the Paris of Jean Goujon, of Germain Pilon, Puget, Rude, Barye, etc. will have become the Paris of Monsieur Eiffel.
Listen to our plea! Imagine now a ridiculous tall tower dominating Paris like a gigantic black factory smokestack, crushing with its barbaric mass Notre Dame, Sainte Chapelle, the Tour Saint-Jacques, the Louvre, the dome of Les Invalides, the Arc de Triomphe, all our humiliated monuments, all our dwarfed architecture, which will be annihilated by Eiffel's hideous fantasy. For twenty years, over the city of Paris still vibrant with the genius of so many centuries, we shall see, spreading out like a blot of ink, the shadow of this disgusting column of bolted tin.9
Although built of iron, it is an inherently inferior material and a single beam is unable to withstand large stresses. That is why the tower appears over engineered by today's standards. Though, from this very weakness its' simple beauty is found. If you look at the tower, the tight lattice work of beams sort of mimic the biological cellular structure of a plant.
In 1855, Sir Henry Bessmer discovered a process of converting iron into steel thereby making it much stronger and lighter, but the evolution from invention to practical use and mass production took many years. Steel would eventually replace iron and would bring the "sky scraper" to the city skylines of America and in 1885 (actually four years prior to the Eiffel's tower), William LeBaron Jenney built the Home Insurance Building in Chicago -- the first sky scraper.
On Aesthetics, Part One
I was at a local cleantech "Earth Day" fair in Atherton CA over the weekend. Had some good discussions with Akeena and Solar City sales teams. I wanted to know about 1.) how they do online internet monitoring for the power delivered from solar, and 2.) whether they saw any opportunities for "hybrid" installs combining solar and wind turbines for a better ROI.
For monitoring, I got some leads and will post an update soon. A quick internet search gets you to Fat Spaniel, but this looks like potentially overkill for my needs to monitor our first 3 kW test install. (please feel free to email me any leads/info on Internet-based remote power monitoring systems.)
For hybrid residential systems, I don't think there is any immediate traction in the Bay Area. For one, there are not that many residences in Northern California in Wind Class 2, let alone Wind Class 3-4 where the ROI and paybacks would be most compelling. Secondly, these guys are so utterly busy, that they can't scale their installers to keep up with present Solar-Only deman. (If it ain't broke...). And lastly, both sets of folks related stories about customers thinking about solar, but abandoning the projects based on "aesthetics."
We're still not in power crunch or carbon crunch mode. In crunch mode, people won't be "picky" about how their power delivery systems look.
Friday, April 20, 2007
Renewable power paybacks, Part One
Anyone who has ever contemplated installing solar panels or wind turbines to "go green" and offset their electricity consumption with renewable power has run into the payback model. The model measures how many years before the money you put into a system is "earned back" in the savings you make from offsetting your electric bill with by generating local, renewable power.
It's the primary way that the costs of installing clean power are measured and here's how it works.
To calculate your payback model, you'll need to know the following inputs:
1. Cost of System
2. Rebates
3. Expected Yearly Power Output of System
4. Today's Grid Tie-In Price For Local Power Output
5. Rate of Increase in Power Prices
6. Cost of Money (Interest Rate)
Many of these inputs have a high degree of regional variability, which is one of the reasons that payback models seem complicated. Certainly the install costs, power output, local power price, and rebates can all change depending on what State you live in. For my model, I will use California as my reference. California in many respects is the "Best Case" model for renewable power, because the rebates, power produced, and power purchased by the utilities are all some of the highest in the country. It's also more expensive to install, but those other benefits usually outwiegh that higher expense.
Let's Now Compare Power Payback Models for Home-based Solar (3kW) and Wind (3kW)
#1. TOTAL SYSTEM COST
3 kW Solar System (Installed Cost) : $28,500 (aka $9.50/watt is typical in CA)
3 kW Wind Turbine System (Installed Cost): $20,000
ASSUMPTIONS: I am using conservative numbers for each of these. In theory, you might be able to get these installed for a lower cost point.
#2. REBATES
SOLAR SYSTEM COST AFTER REBATE: $17,100
WIND SYSTEM COST AFTER REBATE: $12,500
The State of California offers substantial rebates for both large and small commercial solar electric systems through the California Solar Initiative (CSI). Depending on the size of your facility, you will qualify for either the Expected Performance Based Buydown (EPBB) or a Performance Based Incentive (PBI) program.. These rebates can cover as much as 40% of the total system cost. For my math, I'll assume that the rebates get you the full 40% cost reduction.
Fortunately, the State of California is also quite aggressive with Wind Turbine system rebates. The California Energy Commission is offering cash rebates on eligible grid-connected small wind renewable energy electric-generating systems through its Emerging Renewables Program (ERP). This rebate for wind provides $2.50 up to the first 7.5kW nameplate systems.
#3. EXPECTED YEARLY OUTPUT
Solar: 3,780 kw/hrs per year
Wind: 5,940 kw/hrs per year
One of the benefits of solar power over wind power, from a consumer standpoint, is that it's easier to calculate expected yearly power output, and the variance in total power produced is lower (how much your calculation could be off should be low). There are quite a number of complexities even for determining solar. See a good summary of factors afftecting solar power production here.
I've written about nameplates versus total power produced starting here, but to calculate the total power produced for wind is something I will leave for a different blog post. It's probably even more complex than the solar reference above, and there is a much higher degree of variance, site to site, in the same geographies (even same site depending on where the system is installed, shading, height, etc.)
#4. California Residential Retail Power: 13.07 c
I used the PG&E rate available from the California Energy Commission weighted rates table here.
#5. RATE OF INCREASE IN POWER PRICES
1%, 5%, 20%
Depends on scenarios into the future...In some respects, this is the most important variable in the equation, and yet, it's the least known to us today. If you think long term energy prices will remain where they are today, you probably won't be purchasing solar or wind. The math on today's cheap energy prices "doesn't add up." When people do buy these systems, it's because they either believe long term prices are headed much higher, or they are price-insensitive and can afford to go green regardless of the economics. When I model out paybacks, I'll use three scenarios here: 1% (less than inflation), 5% (present status quo), 20% (bad moon rising).
#6. Cost of Money
5.3 %
I used BankRate.Com and assumed a best case, long term money market account with $10k minimum.
So, we're now ready to go. Check back for Part Two, how to run the model next.
Wednesday, April 18, 2007
Please Vote!

I've submitted a proposal for the ChangeThis manifesto site. Would greatly appreciate if you:
1. CLICK THIS LINK TO THE CHANGETHIS PROPOSAL PAGE
&
2. CLICK "YES, WRITE THIS MANIFESTO."
My proposed manifesto will highlight technical, business, and social realities required to make urban-scale wind power feasbile.
thanks,
jeremy
Meet Wind-Sail Live
I will be on a cleantech panel at the Palo Alto chapter of the Jewish Leadership Federation. Please feel free to stop by and say hello. Click here for details for the panel on cleantech entrepreneurship.
Tuesday, April 17, 2007
Contrasts

Today, friends emailed me almost completely opposite views on the future prospects of cleantech. From CNN, we have a bullishly 'anti-green' interview with EXXON CEO Rex Tillerson: "I don't have a lot of technology to add to moonshine," says Tillerson of ethanol.
From the New York Times, we have a very long piece by Thomas Friedman on the power of green as a "geostrategic, geoeconomic, capitalistic and patriotic" way for America to proceed.
From Tillerson, we get the unabashed champion of capitalistic pursuit of profits in oil tech. And based on Exxon performance, he runs that business very well.
From Friedman, we get some very compelling business, political, and environmental reasons to pursue green as a stratetic initiative. He is dead right to say that government must find a way to price the carbon emissions these fuels put into the air. But he totally, utterly misses when he states that: "presidential candidates need to help Americans understand that green is not about cutting back. It’s about creating a new cornucopia of abundance for the next generation by inventing a whole new industry."
I don't agree. I think the mindset that says that our present consumption in the First World is supportable going forward as an a priori to considerations of green and sustainability is dangerously wrong headed. Unless and until we can find replacement technologies that provide the same (or more) aubundance than dirty tech provides, it is NOT at all clear that green can mean no hard trade-offs or reductions.
It's really two problems: how to shift away from dirty tech and maintain an acceptable quality of life (not necessarily growing aubundance for the rich), and how to bring up the worldwide quality of living for the vast billions living in abject poverty without using those easy, dirty methods to get there. Of course I want more aubundance, but I suspect that cheap, dirty fossil fuels provide a bigger pie than sustainable, green practices. Maybe we must accept a smaller pie? I want my politicians brave and capable enough to see and communicate that to the American people.
Sunday, April 15, 2007
Imagining the Vertical farm

One of my favorite blogs is the BLDG BLOG. They've got a post this week that makes me scratch my head though. Check out the "Vertical Farm" write up here - it describes the necessary components to build an urban-scale, self contained structure for living and agriculture.
Yet, they ruin it for me with those silly turbines on the top...Any fan of Wind-Sail or vertical axis turbines will immediately see the folly in spending all that precious rooftop real-estate to get such measely swept area from those horizontal turbines. are those fixed in wind-direction too? so you only get 1/4 of the turbines working at any one time? clearly, a well designed, much large, single omni-directional vertical turbine could get 4x-10x more power from the same footprint.
Tuesday, April 10, 2007
Lean and Clean San Francisco

With a $100M bond, and a goal to grow renewable power from 2 MW to 35 MW in a decade, San Francisco is aggressively trying to establish itself as a Green City leader. To speed up the deployment of renewable power in the City, the Public Utilities C0mission recently posted a Request for Information (RFI). (link)
I've written in the past about Wind Permits, and seeing RFIs like these are exactly the kinds of efforts required to accelerate and tear down procedural and policy hurdles to clean wind tech.
From the RFI:
"While San Francisco has a fairly high rate of renewable-power installation relative to other US cities, these number fall far short of the ambitious goals proposed in the City’s 2002 Electricity Resource Plan. The plan called for 50 megawatts of installed solar PV and 72 megawatts of local distributed generation capacity city-wide by the end of 2012, as well as 150 megawatts of wind power located outside San Francisco. "
In fact, Wind-Sail's first pilot install on Treasure Island is considered as a "municipal" project, and it is our hope that we can begin to accelerate the permitting and ordinance issues by working directly with the City and SFPUC to "streamline" permitting. From our response:
"The single most important accelerator for our business is to demonstrate the feasibility and practicality of our systems in urban environments. As such, we are very flexible to leasing, donating or partnering with SFPUC to provide these turbines for
Addendum: Nathan Nayman of the SF Examiner also has an additional write-up for the effort here. (link)
Sunday, April 8, 2007
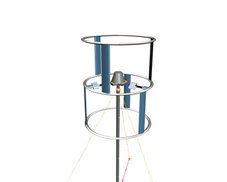
About Wind-Sail

Optimized Urban-Scale Wind Power
Wind-Sail has developed a patented vertical-axis wind turbine that delivers breakthrough performance, cost, and operational benefits specifically optimized for urban-scale clean power. Based in the Bay Area, California-based Wind-Sail is now seeking venture capital to certify initial 3 kW platform and launch global sales and contract manufacturing.
Wind-Sail Overview
Wind power today is a $27 Billion market worldwide, growing at 40% yr/yr[1], with ever larger turbine systems deployed as utility-scale wind farms. To maximize the power these turbines can produce, these farms are typically placed in the highest wind regions in the world. Yet, most people don’t live in Class 5 wind regions, and furthermore, most people in urban environments would not want or could not feasible deploy these massive systems – with spinning blades that approach the speed of sound and are bigger than Boeing 777 airplanes.
Wind-Sail was founded on a belief that significant wind power opportunities exist in for urban-scale small and mid-range power applications (1-3 kW, 30-50 kW systems). However, to be successful in urban environments, new approaches, new formats, and key new features were required to make wind turbines practical for city applications.
Based on scientific and engineering research funded by Lawrence Berkeley Labs, Wind-Sail has innovated a vertical axis wind turbine (VAWT) with best-in-class aerodynamic efficiency and performance features for commercial and urban-scale power applications. Our competitive advantages are driven by these key urban benefits of the VAWT:
§ Optimized Efficiency: Highest CPP (40%) of any distributed wind power system. System is omni-directional, capturing the gusty, variable winds that are typical in urban and light/medium wind regimes.
§ Smaller Footprint: Compact design ideal for constrained environments in industrial, urban, campus, and hybrid solar applications.
§ Innovation Through Simplicity: System is easier to manufacture (fewer parts).
§ Scalability: Will scale from 1 to 50 to 500 kW formats.
§ Operational savings: more reliable with one bearing set, more durable with slower spinning blades, and less maintenance than any turbine on the market today.
§ Multiple configuration options: Turbines can be stacked, installed sideways, upside, or at any angular dimension for applications where space constraints or wind conditions necessitate new formats. In addition, because there are no significant blade clearance issues below the turbine, system can be installed in certain applications without costly towering installations or foundations.
Wind-Sail’s turbine technology has been computer simulated, water and air tunnel tested, prototyped, fine-tuned, patented, and now scaled to successful working models in 1, 3 and 30 kW formats. One of the working units has a small video demonstration at: www.wind-sail.com
Wind-Sail Team
Wind-Sail's executive team has over 40 years of experience in the engineering, production, sales and executive management in electric motor and power component industries.
• Rich McClellan, PhD, CEO
Veteran executive of 3 electronics startups sold to Parker-Hannifin, Motorola, Printronix. Doctorate and is industry expert in power electronics.
• Rick Halstead, CTO
Power industry innovator with extensive management, sales, and technical development expertise with alternators engineered for harsh environs.
• Vladimir Krivopickj, PhD, Technical Leader
Leads core blade/turbine design team. Aerodynamic engineer with
30 years of experience in
• Chris Larson, Project Leader
25 year veteran of PG&E with project management experience across plant, grid, substation and environmental projects in the Bay Area. Leads the site management and permit applications for our Treasure Island install project.
• Jeremy Stieglitz, Marketing & BD
15 year high technology veteran with experience launching and growing product lines of $2M-$800M for Microsoft, RSA, and Cisco Systems.
Competitive Position
There are several companies selling small scale wind turbines based on traditional, horizontal axis propeller based turbines, including Bergey and Southwest Wind. There are also a growing number of VAWT turbines, primarily selling in
Patents protect key innovations in the aerodynamics of the blades, vertical orientation of the system, the system wind loading and blade configurations, aerodynamic ring structure, the alternator, and the electronic control optimizations for distributed wind.
Markets
The global market today for distributed wind power is today a $400M market, and is forecasted to grow 10x over the next 10 years to $4BN. According to the American Wind Energy Association (AWEA), “to date about 110 MW of “small-scale” community wind capacity is installed in the
Needs from Investors:
Wind-Sail has had no external investment and corporate structure remains flexible. We are seeking $1.5m-$2m in seed/angel funding to establish key first customer deployments in strategic and tactical sales opportunities. An additional investment of $5-$7M will be sought to grow the launch team, scale contract production, establish global distribution and sales offices, and expand sales and marketing programs worldwide.
Summary Contact Information:
(650) 575-2317
Friday, April 6, 2007
More Pitching Advice
Guy Kawasaki has a solid set of advice for pitching to VCs posted to his blog. (link).
Updated Pitch
I really enjoyed Bill Reichert's advice for pitch decks and have tried to update the Wind-Sail pitch to better match the advice outlined in his piece.
Check out the new Wind-Sail pitch, now with new and improved, BIGGER FONT SIZES. Click the pic!
Wind-Sail At Demo Show (Someday...)
Chris Shipley is the founder and director of the Demo trade show. It's billeted as the launchpad for emerging technology, and true to it's advertising, every year some of the coolest new product launches happen there. (Google, Ebay, E*Trade, Sun's Java, Tivo, Skype, the Palm Pilot, etc. etc. ). Well, in reading about this year's upcoming show, I decided to make a run at pitching "Wind-Sail" with a very short email to Chris: "wouldn't it be sweet to see one of these beauties up on stage..."
Well, we did end up discussing Wind-Sail in good detail. And we agreed that we are probably "too early" for a Demo launch - at least, until we are in production with a certifiable unit.
The conservation wasn't all in vain, as it also led to a very excellent write up by a collegue's of Ms. Shipley's, please check out Janet Rae-Dupree's Wind-Sail blog post here. It's the rarest of interviewers who gets things exactly right, and nothing wrong, and lucky for us, Ms. Rae-Dupree has done this in this most excellent write up. (link)
Wednesday, April 4, 2007
Wall Street Journal On Wind Economics
The Wall Street Journal has a great piece today on the "new math" of renewables and how they are approaching cost-competitiveness with traditional dirty tech energy sources.
..."Wind power stands out as one of the splashiest success stories in renewable energy. Over the past 10 years, as wind farms sprouted around the world, the cost of generating electricity from wind has fallen dramatically.
In 1980, wind-power electricity cost 80 cents per kilowatt hour; by 1991 it cost 10 cents, according to the International Energy Agency.
Today, production costs at the best on-shore sites have dropped as low as 3 cents to 4 cents per kilowatt hour, but are more typically 6 cents to 9 cents, not counting subsidies -- getting closer to the cost of generating electricity from burning coal. In fact, costs are approaching the point where wind power may be able to prosper without subsidies -- currently 1.9 cents a kilowatt hour in the U.S. -- particularly if natural-gas prices stay high.

(link)
All Bearings Fail
Recently, I was presenting to a venture capital firm and got asked about the maintenance features of our turbine platform. It was a fair question, and one that I didn't answer very well. We do have some significant features in maintenance/durability/simplicity, and I did cover some of the blade resiliency characteristics. Where I got into trouble was around the determination in which one of the VCs believed that "all bearings fail." On the notion of bearings and mean time between failures (MTBF) the conversation went something like this:
VC: What will you do when the bearings fail?
Jeremy: Talks about loads being center-balanced, talk about 180 RPMs as our max, talks about the six-bladed design giving continious, smoothed and non-sinusoidal power pulses to the system...
VC: All bearings fail. When your bearings fail, this is going to rip out of the rooftop when it comes falling over...
Jeremy: Dumbfounded and deer in headlights reaction...
In hindsight, I could have also talked about the expected 15-18 years of mean time to failure ratings on our bearing sets (our bearing sets are rated for 200-300 million RPMs under designed loads)... But of course, I had to go look that up later with the technical team. I also found out that we can promote that there are no flexing or moving parts in the Wind-Sail alternator, and the magnets move past fixed coils. So other than age effects on materials, or thermal problems from overload, the alternator should never wear out. I could have also talked about wind loading on the system, and that frozen bearings present nearly the same load as the system is under braking scenarios (e.g. we don't model our loads so that we are dependent on spinning as a way to prevent being torn away from the roof.)
A couple of closing comments:
1. One of the challenges that I actually enjoy about presenting to VCs is that there are countless holes/traps that you can fall in, and you can never predict which ones are coming. It's mental surfing and it's invigorating learning how to stand on that board. In time, maybe I can ride some of the bigger waves.
2. I can also add "all bearings fail" to my growing list of dispassionate VC beliefs that I need to learn how to avoid falling into, other traps have included: 'distributed grid power won't work', and 'farmers don't care about bird kills- they kill birds for a living', and lastly 'unless you get under $1 a watt, this won't ever be viable.'
On Maps, Innovation and Cleantech
I love maps. Any kind, new or old. And I've been known to spend literally hours in map stores agape at their beauty, elegance, and moment-in-time aspects. When I can afford them, it is my longstanding goal to be an avid collector.
I used to think that maps were static, and with our modern GPS and satellite driven imagery, a limited space for innovation. But I also remembered a whole team of geographers and mappers that were hired into Microsoft in 1992. That was my first early signal that mapping could be matched to technology to produce new innovation. Microsoft went on to create a $100 million business in online mapping software, but more importantly, mapping online and mapping mashups have exploded onto the scene.
Play the tape forward to 2007, and the notion of mapping technologies as cool is bleedingly obvious. In fact, not a day goes by that I don't see new map mashups. Here's one for London that is color-coded to transportation ease of use.![]() Clearly, updated daily traffic maps are well known and found on every morning tv news broadcast. But with digital mashups, what about mixing traffic patterns with London regional house prices, or if you think that there will be more plague-born insects, or if you think it's going to get hotter, house prices, pools.
Clearly, updated daily traffic maps are well known and found on every morning tv news broadcast. But with digital mashups, what about mixing traffic patterns with London regional house prices, or if you think that there will be more plague-born insects, or if you think it's going to get hotter, house prices, pools.
Basically, since the calibrations are constantly changing, so will the maps. In time, I hope to look for more mashups specific to cleantech and have already looked at some cursory notions of geography and cleantech in previous posts, starting with All Power Is Geography.


I would add one more rule/advice...
Don't try to move investors in two dimensions of risk. (If you are in a new market, you better have a solid team/differentiator/track record, and vice-versa. investors won't be inclined to take risks in any more than one of these, preferably none.
From firsthand experience pitching Wind-Sail to more than a few VCs at this point, the small and mid-scale wind market is deemed risky, and since our technology and product are not commercially certified, risks are present in two dimensions. Clearly, we are working to get our first installs to overcome product/technology risk, but that takes time and money :)