Anyone who has ever contemplated installing solar panels or wind turbines to "go green" and offset their electricity consumption with renewable power has run into the payback model. The model measures how many years before the money you put into a system is "earned back" in the savings you make from offsetting your electric bill with by generating local, renewable power.
It's the primary way that the costs of installing clean power are measured and here's how it works.
To calculate your payback model, you'll need to know the following inputs:
1. Cost of System
2. Rebates
3. Expected Yearly Power Output of System
4. Today's Grid Tie-In Price For Local Power Output
5. Rate of Increase in Power Prices
6. Cost of Money (Interest Rate)
Many of these inputs have a high degree of regional variability, which is one of the reasons that payback models seem complicated. Certainly the install costs, power output, local power price, and rebates can all change depending on what State you live in. For my model, I will use California as my reference. California in many respects is the "Best Case" model for renewable power, because the rebates, power produced, and power purchased by the utilities are all some of the highest in the country. It's also more expensive to install, but those other benefits usually outwiegh that higher expense.
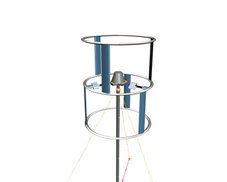
Let's Now Compare Power Payback Models for Home-based Solar (3kW) and Wind (3kW)
#1. TOTAL SYSTEM COST
3 kW Solar System (Installed Cost) : $28,500 (aka $9.50/watt is typical in CA)
3 kW Wind Turbine System (Installed Cost): $20,000
ASSUMPTIONS: I am using conservative numbers for each of these. In theory, you might be able to get these installed for a lower cost point.
#2. REBATES
SOLAR SYSTEM COST AFTER REBATE: $17,100
WIND SYSTEM COST AFTER REBATE: $12,500
The State of California offers substantial rebates for both large and small commercial solar electric systems through the California Solar Initiative (CSI). Depending on the size of your facility, you will qualify for either the Expected Performance Based Buydown (EPBB) or a Performance Based Incentive (PBI) program.. These rebates can cover as much as 40% of the total system cost. For my math, I'll assume that the rebates get you the full 40% cost reduction.
Fortunately, the State of California is also quite aggressive with Wind Turbine system rebates. The California Energy Commission is offering cash rebates on eligible grid-connected small wind renewable energy electric-generating systems through its Emerging Renewables Program (ERP). This rebate for wind provides $2.50 up to the first 7.5kW nameplate systems.
#3. EXPECTED YEARLY OUTPUT
Solar: 3,780 kw/hrs per year
Wind: 5,940 kw/hrs per year
One of the benefits of solar power over wind power, from a consumer standpoint, is that it's easier to calculate expected yearly power output, and the variance in total power produced is lower (how much your calculation could be off should be low). There are quite a number of complexities even for determining solar. See a good summary of factors afftecting solar power production here.
I've written about nameplates versus total power produced starting here, but to calculate the total power produced for wind is something I will leave for a different blog post. It's probably even more complex than the solar reference above, and there is a much higher degree of variance, site to site, in the same geographies (even same site depending on where the system is installed, shading, height, etc.)
#4. California Residential Retail Power: 13.07 c
I used the PG&E rate available from the California Energy Commission weighted rates table here.
#5. RATE OF INCREASE IN POWER PRICES
1%, 5%, 20%
Depends on scenarios into the future...In some respects, this is the most important variable in the equation, and yet, it's the least known to us today. If you think long term energy prices will remain where they are today, you probably won't be purchasing solar or wind. The math on today's cheap energy prices "doesn't add up." When people do buy these systems, it's because they either believe long term prices are headed much higher, or they are price-insensitive and can afford to go green regardless of the economics. When I model out paybacks, I'll use three scenarios here: 1% (less than inflation), 5% (present status quo), 20% (bad moon rising).
#6. Cost of Money
5.3 %
I used BankRate.Com and assumed a best case, long term money market account with $10k minimum.
So, we're now ready to go. Check back for Part Two, how to run the model next.
Friday, April 20, 2007
Renewable power paybacks, Part One
Subscribe to:
Comment Feed (RSS)


|